|
STATUS:
07.28.2015
Instrument Status:
The AIM spacecraft continues to perform well. This month we uploaded a new Orbit Definition Table via our alternate command path. This table will improve the pointing accuracy by better compensating for the increased Beta (sun) angle. This table will be installed on July 28.
CIPS:
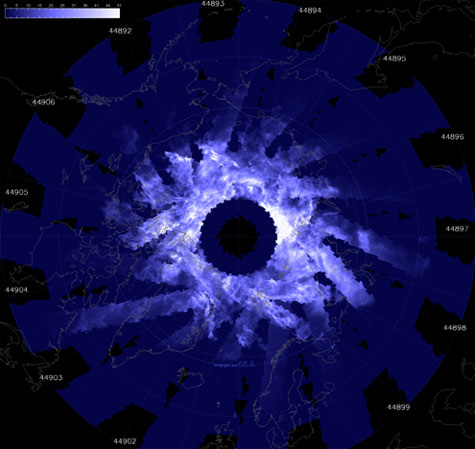
The CIPS instrument continues to perform well, with no health issues. The NH 2015 PMC season is in full swing now. The daily daisy below shows the preliminary data for 16 July. Note that the cloudy areas on each orbit strip are narrower than in past seasons. This is because the daisies for the current season include only data with a quality factor (QF) of 0. The QF value indicates the number of overlapping measurements that can be used to determine the cloud scattering phase function (albedo vs. solar zenith angle) for any single location. QF=0 signifies 7 or more measurements, QF=1 signifies 4-6 measurements, and QF=2 signifies fewer than 4 measurements. With the changing beta angle, the retrievals are more sensitive to this parameter, so artifacts can appear if there are fewer than 7 overlapping measurements. Points closer to the edges of the orbit strips have QF values of 1 or 2, so they do not appear in the current season daisies. In addition, although not very obvious in the daisy shown here, we have been seeing more false detections this season than in the past. This is also caused by the changing orbit, and results in unreasonably high cloud frequencies. The CIPS team is working to address these issues through modifications of the retrieval algorithms.
 |
|
|
|
Figure caption. AIM/CIPS PMC albedo for 16 July 2015. This is "preliminary" data, but the final data will look very similar.
Browse CIPS Daily Daisy Images
http://lasp.colorado.edu/aim/browse-images.php
SOFIE:
The SOFIE instrument continues to operate normally. SOFIE is currently observing the Northern Hemisphere 2015 PMC season, viewing latitudes of 50 - 60 degrees. These data are undergoing special processing to account for changes due to the increasing beta angle, and will be released soon.
SOFIE results describing the influence of PMCs on water vapor and the drivers behind PMC variability were recently published in Hervig et al. [2015]. These results quantify dehydration resulting from ice growth and vapor enhancement resulting from ice sublimation. The altitude of peak dehydration was found to exist on average ~1.8 km above the height of peak ice mass density, and the altitude of peak hydration was found to be ~0.3 km above the observed ice layer bottom altitude. The column abundance of H2O was roughly equal in the dehydration and hydration layers, but less than that contained in the ice layer, a difference that may be due to meridional transport. The dependence of PMCs on water vapor and temperature was quantified, accounting for the effects of ice on water vapor. Results in the Northern Hemisphere indicate that PMC variations are dominated by temperature, but that a combination of temperature and water vapor provides the best explanation of the observations. In the Southern Hemisphere PMC variability is attributed primarily to temperature, with water vapor playing a minor role (see Figure below). The SOFIE results were extended to interpretation of Solar Backscatter Ultraviolet (SBUV) PMC observations, which span 1979 - present. Using recently reported SBUV PMC trends at 64 - 74°N latitude with the results of this study indicates a cooling trend of -0.27 ± 0.14 K decade-1 and a water vapor increase of +0.66 ± 0.34 % decade-1 (both at 80 - 84 km). This cooling trend agrees with reports based on observations in the middle atmosphere at similar latitudes. The water vapor increase is lower than expected due to increasing methane, although this difference may be consistent with H2O loss due to photolysis at PMC altitudes.
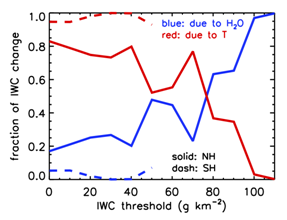
The fraction of IWC anomaly due to temperature, and due to water vapor, versus IWC threshold determined from the multiple regression to SOFIE results as July averages in the Northern Hemisphere (NH) and January averages in the Southern Hemisphere (SH). Note that the SBUV PMC detection threshold is IWC > 50 g km-2.
|